Royal Melbourne Hospital basement GPR survey
Prepared for Icon. Scanned 9 November 2026 with a Proceq GP8000, dielectric constant 4.9. Each model shows the scan lines on the slab and the base of slab hanging below them at true scale, so you can rotate it and see where the slab is thinner and thicker.
Drag to orbit · scroll or pinch to zoom
Scan line
Slab depth readings, all three areas
| Area | Line | Length | Minimum | Maximum | Source |
|---|
Back-wall tags are the minimum and maximum base of slab picks set in the Proceq app. Cursor readings were read off the B-scan screen and are not tagged in the data. BT-001 and BT-002 were test scans and are not reported. BT-015 and BT-016 started outside the 3D model, so only the section across the cut-out floor with the blue writing is shown, about 5 m of each.
Pilot hole check, brick-wall area
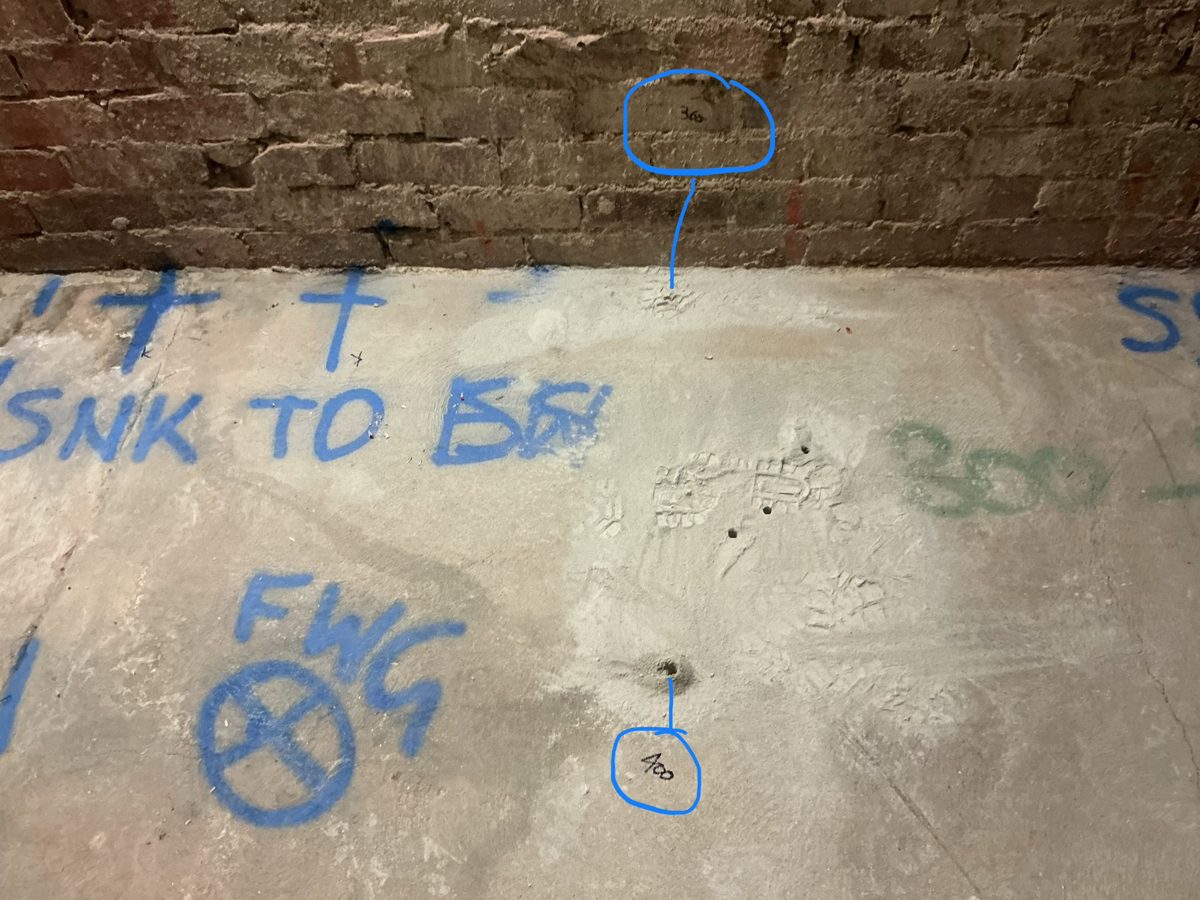
| Pilot hole | Drilled | Nearest GPR | Difference |
|---|---|---|---|
| At brick wall | 300 mm | 303 mm (BT-009) | 3 mm |
| Mid slab, beside FWG | 400 mm | 381 to 422 mm (BT-007, 010, 011) | within 22 mm |
Holes drilled with a 10 mm bit. Depths written on site in black marker.
HV pit and generator room
| Area | Scan | Result |
|---|---|---|
| HV pit | HV pit 003, 51.06 m | Base of slab 343 mm at 41.68 m, 419 mm at 43.08 m |
| Generator room | LG ceiling and slab scans | Post-tensioned cables located and marked on site in yellow spray paint. No further reporting required for this area. |
Engineer's notebook
Notes are kept per scan line in this browser only. Nothing is sent anywhere.
Method and limits
The base of slab is drawn as a straight line between the tagged depths on each scan and held level beyond them. It is not a trace of the full reflection. All line and pass positions were marked by the operator on the Polycam plans on 11 Nov 2026. Where the scanner was lifted and restarted on one file, each pass is shown separately. GPR depths are approximate and depend on the calibrated dielectric constant of 4.9.